QUESTION A
-
A one-hot-encoded column is a column that takes a categorical representation (for example third class) and outputs the numerical representation (for example [0,0,1]). A one-hot-encoded column is useful in taking categorical columns and transforming them into a numerical column that the computer can then process and use. The source values are continuous.
-
A dense feature seems to just extract all the features including the 0s and 1s. All my data has been extracted into an array. This is important because it keeps references to places with information and places without information. This means that important data that could be signified with large areas with 0s could also be recognized by the model.
\
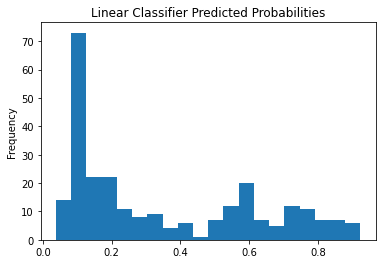
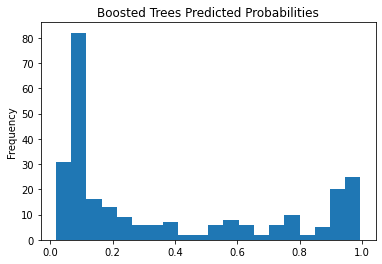
- The models both predict the same thing: the percent chance that the individual will survive the Titanic sinking. The two models predict the chance of survival from the Titanic sinking and graphs the probabililtes that it predicted the individual would survive or not. For example, the model would predict a percentage the individual would survive, and tally the total number of times it calculated the percentage. The two models predicted quite different probabilites. For the boosted trees classifier, it predicted a 0.1 chance of survival 80% of the time while the linear classifier classified a 0.1 chance of survival 70% of the time. Also, the data predicted by the boosted trees classifier was gather around the poles (0 and 1) while the linear classifer had a more even distribution over the data (I say even very loosely, if you ignore the glaring 70% prediction rate). It should be noted that the Linear Estimator had an accuracy of 77% and a precision of 70% and the Boosted Tree had an accuracy of 82% and a precision of 78%. There is not a large difference between both the accuracy and precision (5% and 8% respectively); if there was to be a noticeable difference on the two graphs, there would need to be a larger difference between the precision on the two models.
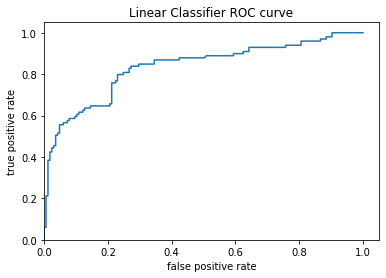
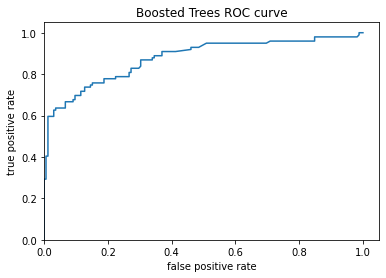
The ROC plot for the linear classifier shows that it is not too bad, but there is a significant decrease in accuracy around the 0.2 false positive rate. The ROC plot for the boosted trees classifier is acutally pretty good: the curve itself is almost a 90 degree angle towards the upper left corner. The larger the area under the curve, the better the model is. Since this curve plots the model’s true postive rate and false postiive rate, we want a high true positive rate and a low false positive rate. Since the true positive rate and false positive rate is summed to 100%, they’re connected and thus create the curve portion.
QUESTION B
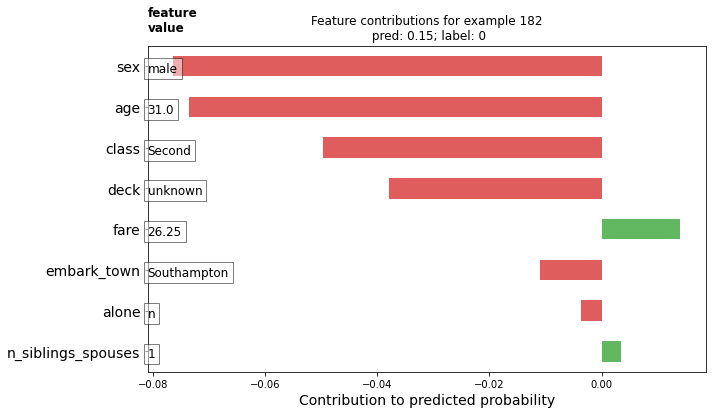
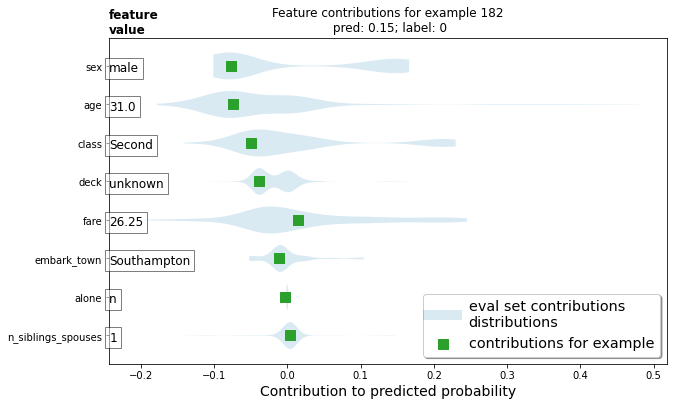
- it seems that your gender and age seem to contribute the most toward the probability towards survival. The feature values contribution graph gives a chart on the features that contribute towards the predicted probability of survival for a particular individual. The red indicates that the individual is more likely to die and the green indicates that the individual is more likely to survive. The violin plot is a more generalized version of the feature values contribution graph that plots the entire dataset with its ranges (max and min) and its contributions. For example, there was a perosn aged 80 on the Titanic and it is reflected in the plot where there is a thinn line that contributed almost +50% to his/her probability of survival. The green square is the location inside the range for the individual selected.
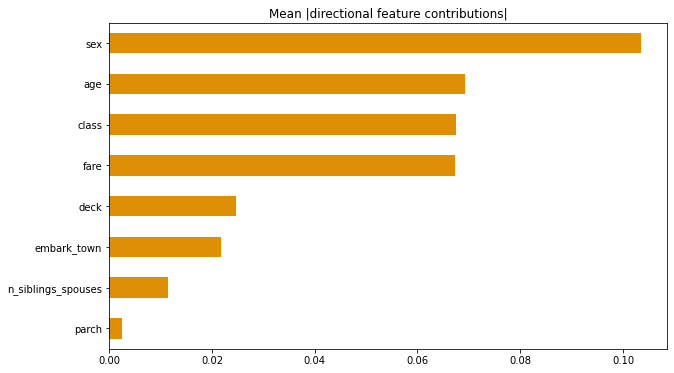
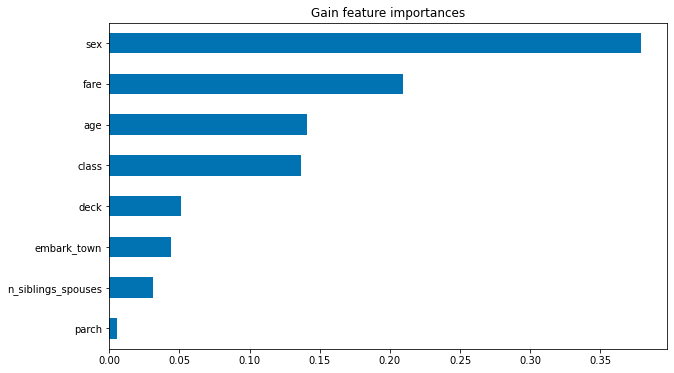
- If looking strictly at gain feature importances (which features increase your probability of surviving?), gender, fare, age and class seem to give you the highest increases. However, if we take into consideration the absolute values, then the features change to gender, age, class, fare (a reorganization of the features which are important). However, it should be noted that the absolute value graph also include the absolute values of features with negative probabilities, which lessen your chance of survival.